March 6th, 2026
What's New in March 2026
We’ve made several updates this month to enhance the power and usability of T-Stats Solutions. From enhanced data loading to improved data import, here’s what’s new:
Enhancement
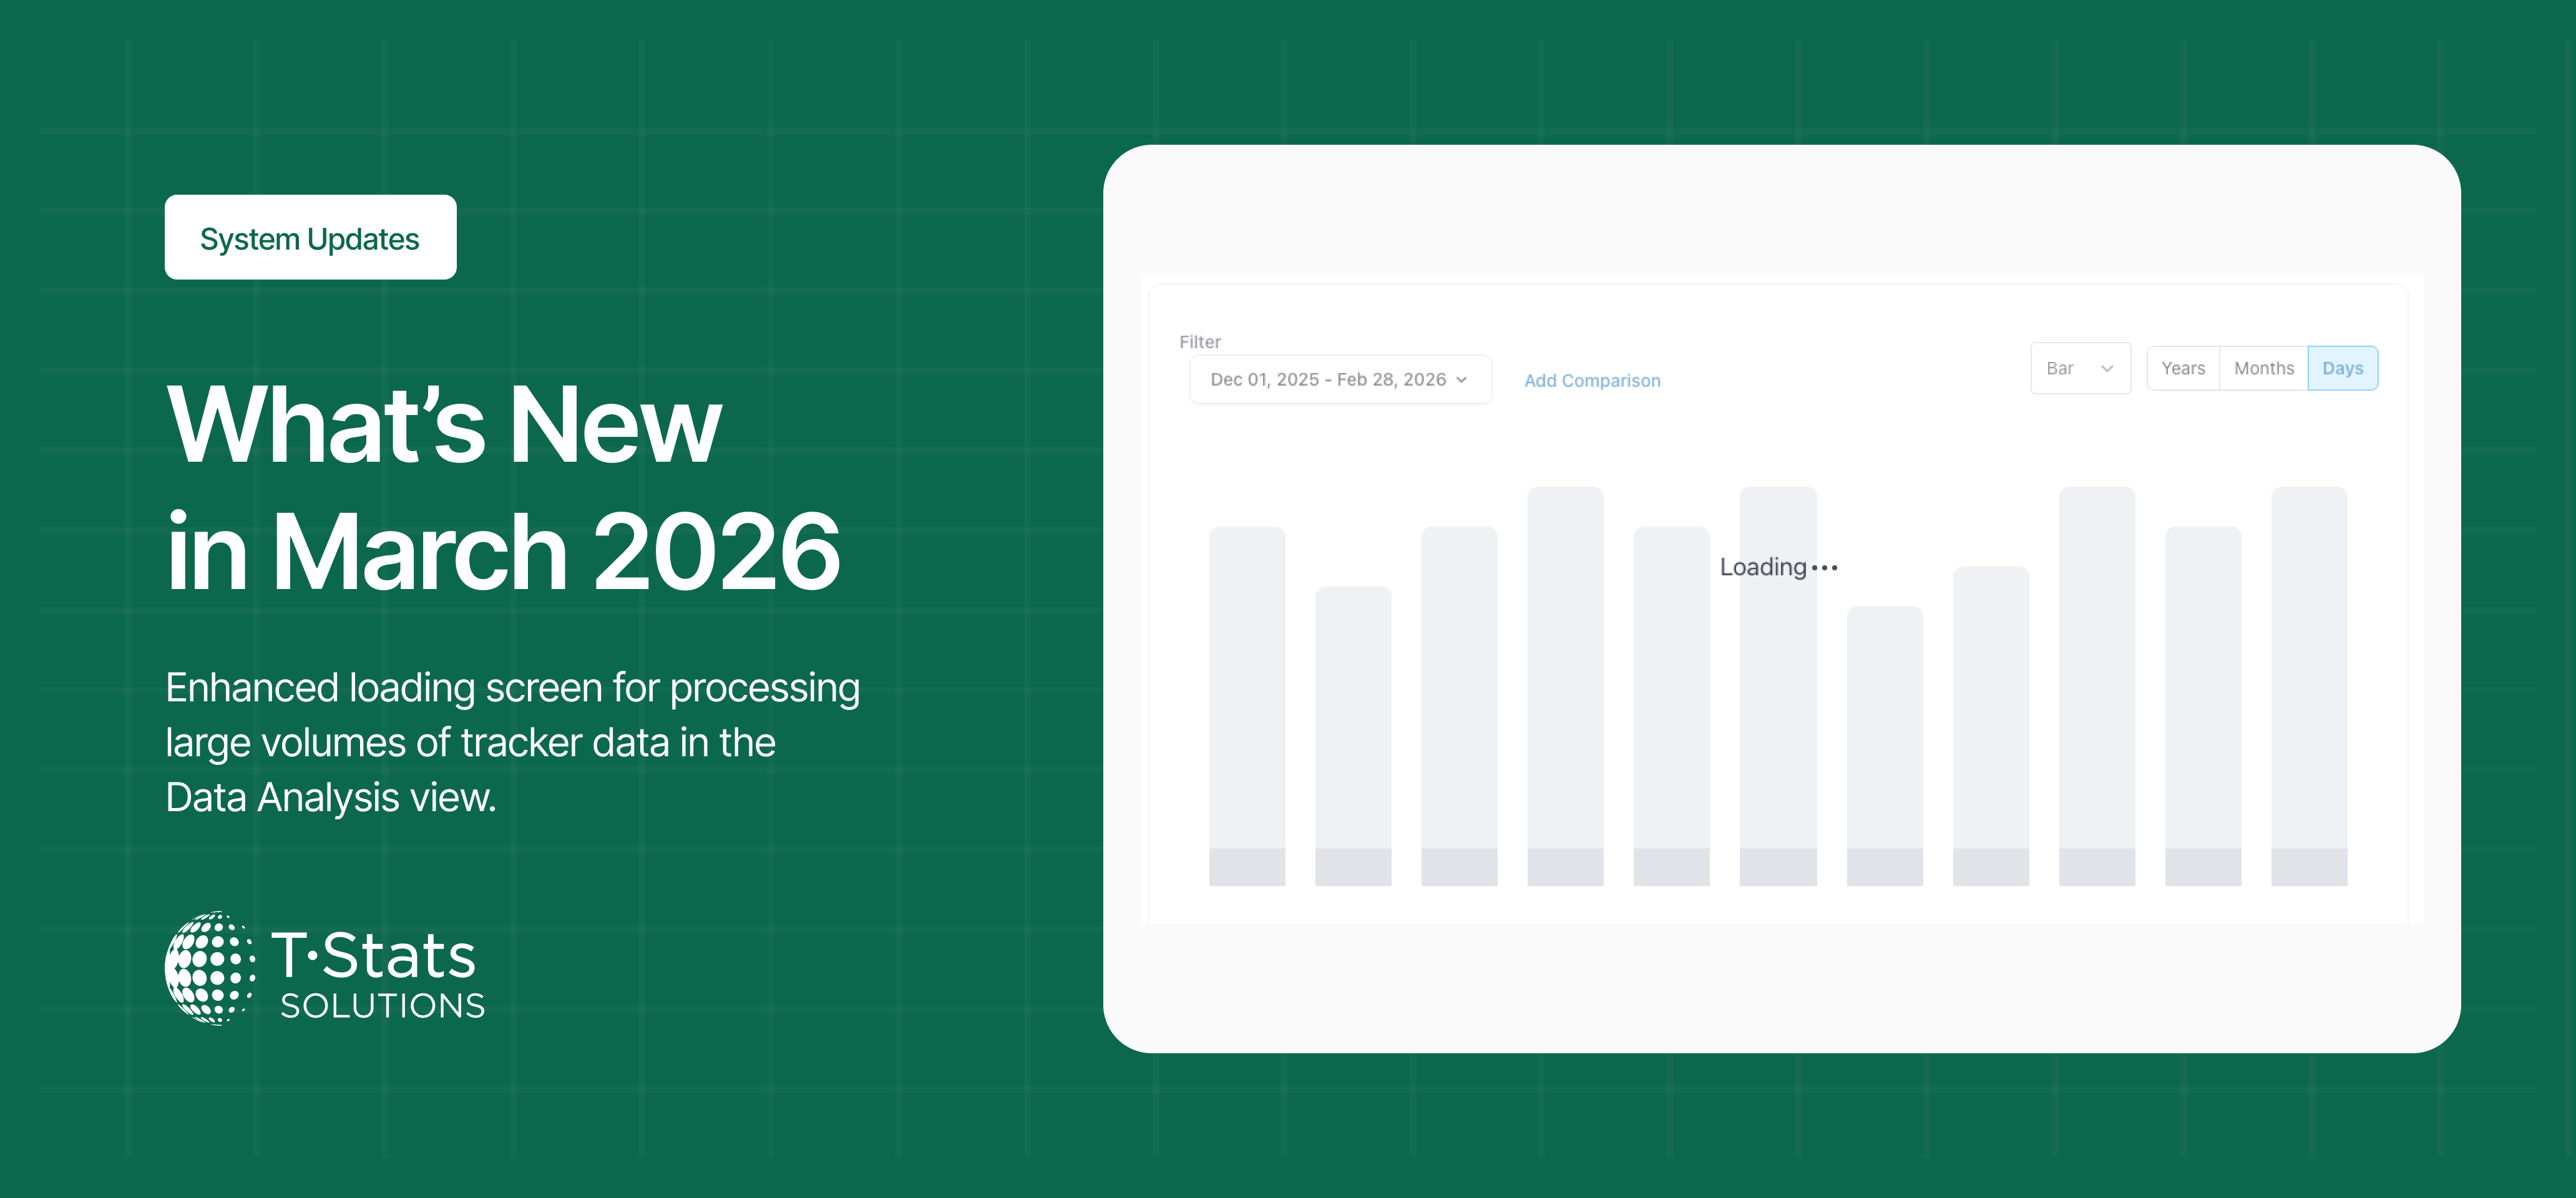
Enhanced Loading Screen for Data Analysis: Improved the loading state when processing large volumes of tracker data in the Data Analysis view. A clearer and more visible loading indicator now appears on screen, reassuring users that their request is being processed.
Bug Fixes
Gateway Timeout on Polygon: Fixed an issue where filtering the Self-Catering KeyData tracker by the polygon resulted in a gateway timeout. Polygon now loads correctly, ensuring consistent performance across all polygon filters.
Tracker Metrics Not Updating Charts: Fixed an issue where selecting different tracker metrics did not refresh the legend or graph. Charts now update immediately after metric selection, ensuring accurate and responsive analytics.
Chart Type Toggle Not Switching View: Fixed an issue where the chart type toggle did not switch between bar and line views. Users can now seamlessly toggle between chart types for better data visualization.
👉 Thanks for using T-Stats! We’re committed to making the platform better for you and your businesses every month. Your feedback helps shape these improvements — keep it coming!